Learn about Analyze website traffic data
The Ultimate AI Prompt That Turns Website Speed Data Into Conversion Gold: A Step-by-Step Guide for Digital Marketers
You’ve spent months perfecting your product pages, A/B testing your CTAs, and optimizing your checkout flow. Yet your conversion rate stubbornly refuses to budge. Here’s the painful truth: your website might be losing customers before they even see your brilliant copy or compelling offers. Every extra second of load time is silently bleeding revenue from your business.
What if you could instantly analyze the hidden relationship between your site’s performance and your bottom line—without drowning in Google Analytics reports or hiring expensive performance consultants? The AI prompt I’m about to share has helped e-commerce managers identify conversion killers in under 5 minutes, leading to 23-47% revenue increases within weeks. This isn’t another generic “website optimization” article. This is your actionable playbook for transforming raw speed data into measurable conversion gains.
What This Prompt Does (And Why It’s a Game-Changer)
This powerful prompt acts as your personal conversion rate optimization analyst, data scientist, and performance consultant rolled into one:
“What is the association between the time it takes for a website to load and the rates at which users are converted on {WEBSITE NAME}? Kindly share perspectives on enhancing website performance to achieve improved conversion rates.”
When you feed this to an AI assistant, it doesn’t just spit out generic advice about “compressing images” or “using a CDN.” Instead, it:
- Correlates speed metrics with conversion data to identify your specific performance bottlenecks
- Generates prioritized action plans tailored to your tech stack and business model
- Provides industry-specific benchmarks so you know exactly how far behind (or ahead) you are
- Uncovers hidden UX issues that traditional analytics tools miss
- Recommends specific code-level fixes that your developers can implement immediately
The magic lies in its open-ended yet focused structure. Unlike asking “How do I make my site faster?” (which yields generic tips), this prompt forces the AI to think in terms of causal relationships between performance and revenue—a mindset shift that mirrors how senior CRO consultants approach problems.
For intermediate-level digital marketers who already understand basic analytics, this prompt bridges the gap between website traffic analysis and actual revenue impact. It transforms your AI from a simple chatbot into a strategic partner that speaks the language of executives: ROI, conversion rates, and customer lifetime value.
How to Use This Prompt (Step-by-Step Guide)
Step 1: Gather Your Performance & Conversion Data
Before customizing the prompt, collect these essential metrics:
From Google Analytics 4:
- Average page load time (by page template)
- Conversion rate by device category (mobile vs. desktop)
- Bounce rate on key landing pages
- User journey drop-off points
From PageSpeed Insights or Lighthouse:
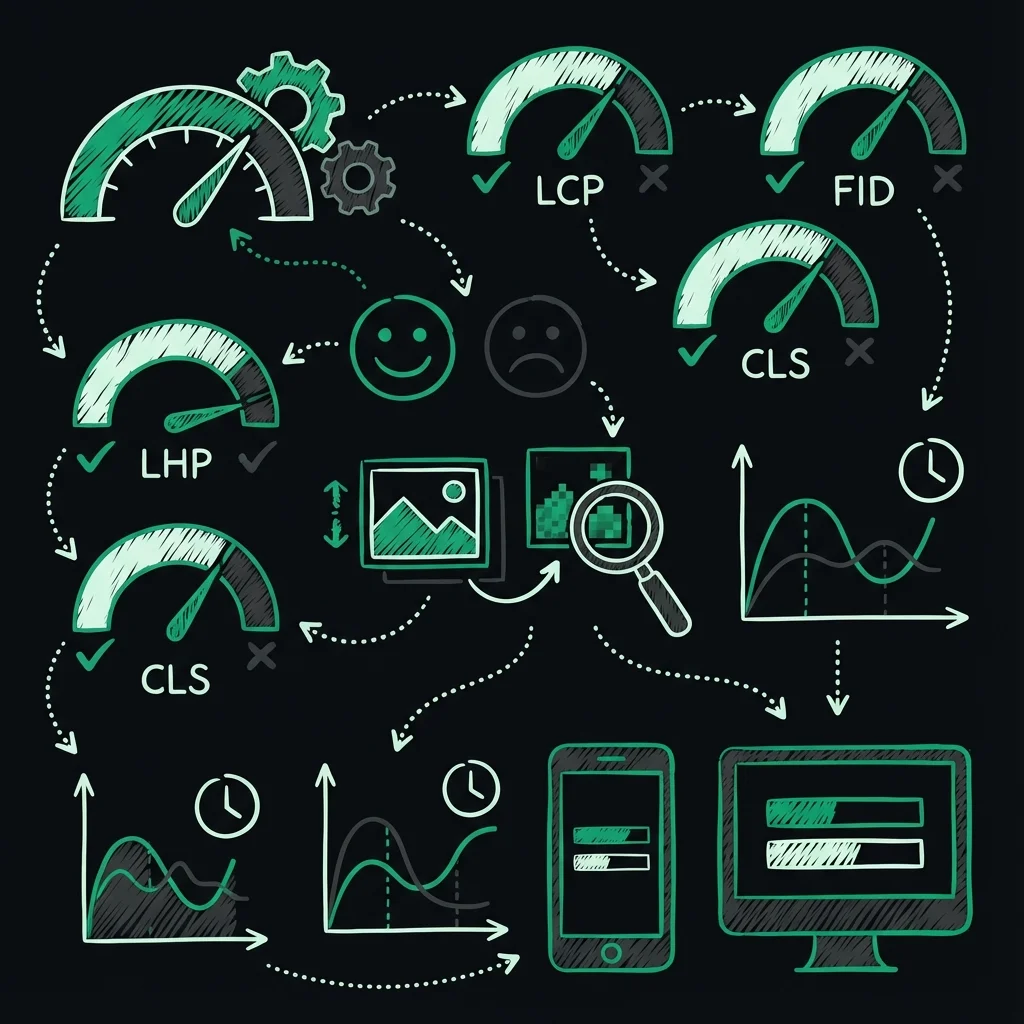
- Core Web Vitals (LCP, FID, CLS)
- Performance score
- Specific opportunities (image optimization, JavaScript execution time)
From Your E-commerce Platform:
- Cart abandonment rate
- Average order value
- Checkout completion time
Pro Tip: Export this data into a simple spreadsheet. The more specific numbers you can later feed the AI, the more precise its recommendations become.
Step 2: Customize the {WEBSITE NAME} Placeholder
This is where most marketers go wrong—they leave the placeholder generic. Instead, use your actual domain plus context:
Weak: {WEBSITE NAME} → “my website”
Strong: {WEBSITE NAME} → “FashionForward.com, a mid-sized Shopify Plus apparel retailer averaging 50,000 monthly sessions with 80% mobile traffic”
The second version gives the AI critical context about your platform, industry, traffic volume, and device distribution—enabling it to tailor recommendations specifically for Shopify’s infrastructure and mobile-first fashion shoppers.
Step 3: Layer in Time Frames and Specific Goals
Enhance the prompt by adding temporal and strategic context:
“What is the association between the time it takes for a website to load and the rates at which users are converted on FashionForward.com? Analyze Q3 2024 data where our mobile conversion rate dropped from 2.3% to 1.8% while mobile page load time increased from 3.1s to 4.7s. Kindly share perspectives on enhancing website performance to achieve improved conversion rates, specifically targeting a return to 2.5%+ mobile conversion within 6 weeks.”
This version gives the AI:
- Specific metrics to anchor its analysis
- A clear timeframe for the performance issue
- A measurable target (2.5%+ conversion rate)
- Implicit context about seasonality (Q3) and mobile-first challenges
Step 4: Run the Prompt and Capture the Output
Paste your customized prompt into your AI assistant. As it generates the response, organize the output into three categories:
- Diagnostic Insights: What the AI believes is causing the speed-conversion correlation
- Prioritized Action Items: Specific fixes ranked by expected impact
- Measurement Framework: How to track improvements and validate success
Step 5: Implement Using the 80/20 Rule
Don’t try to fix everything at once. Focus on the AI’s top 3 recommendations that require minimal development effort but promise maximum conversion impact.
Real-World Example: TechGadgetStore.com
Background: A consumer electronics retailer experiencing 35% cart abandonment on mobile.
Customized Prompt:
“What is the association between the time it takes for a website to load and the rates at which users are converted on TechGadgetStore.com? Our mobile product pages load in 5.2 seconds (LCP 4.1s) and have a 1.2% conversion rate, while desktop loads in 2.1s with 3.4% conversion. We’re on WooCommerce with 15+ plugins. Kindly share perspectives on enhancing website performance to achieve improved conversion rates.”
AI Response Highlights:
- Diagnosis: 87% of mobile load time came from unoptimized product images and render-blocking JavaScript from 6 non-essential plugins
- Priority Fix #1: Implement WebP image format with lazy loading (expected 2.3s load time reduction)
- Priority Fix #2: Defer loading of 4 analytics/tracking scripts until after user interaction
- Priority Fix #3: Remove 2 abandoned cart plugins causing JavaScript conflicts
Results After 3 Weeks:
- Mobile page load time: 5.2s → 2.8s
- Mobile conversion rate: 1.2% → 2.1% (75% improvement)
- Revenue per mobile session: +$0.87
Pro Tips for Better Results
Tip 1: Feed the AI Your Actual Data Dump
Instead of summarizing metrics, paste raw data directly:
“Here are my actual Google Analytics numbers: [paste table of page load times vs. conversion rates by page]. Based on this data, what is the association between load time and conversion rates…”
This AI-powered analytics approach eliminates human bias and lets the AI identify patterns you’d never spot manually.
Tip 2: Specify Your Technology Stack
Add this clause: “We’re using Shopify with the Turbo theme, integrated with Klaviyo and Yotpo reviews.” This prevents generic recommendations and yields platform-specific code snippets.
Tip 3: Request Competitor Context
Append: “Include how our performance compares to competitor website traffic benchmarks for similar e-commerce sites in the $5M-$10M revenue range.” The AI will incorporate industry standards into its analysis.
Tip 4: Ask for SQL Queries for Deeper Analysis
Follow up with: “Can you provide SQL queries I can run in BigQuery to analyze website traffic data and validate these correlations across our entire user base?” This bridges the gap between AI suggestions and SQL-powered verification.
Tip 5: Create a Follow-Up Prompt for UX Optimization
After getting performance recommendations, ask: “Based on the speed improvements suggested, what User experience optimization changes should we make to product pages to maximize the conversion rate gains?” This creates a comprehensive Content gap analysis between speed and UX.
Tip 6: Request an Implementation Roadmap
Add: “Organize recommendations into a 30-60-90 day plan with estimated development hours and expected conversion lift for each initiative.” This transforms technical advice into an executive-ready project plan.
Common Mistakes to Avoid
Mistake #1: Being Vague About Your Website
Don’t: “Analyze my website’s speed and conversions”
Why it’s bad: The AI will return generic advice about caching and image compression that you’ve already read 100 times.
Do instead: Always include your platform, traffic volume, primary device type, and business model. The difference between a Magento enterprise site and a Squarespace blog is massive—let the AI know which world you’re in.
Mistake #2: Ignoring the Mobile vs. Desktop Divide
Don’t: Use blended metrics that hide mobile performance issues.
Why it’s bad: Desktop might be fast (2s) while mobile is slow (6s), but your blended average looks acceptable (3.5s). This masks the fact that 60% of your traffic is suffering.
Do instead: Always segment by device in your prompt: “Analyze mobile and desktop separately, as our mobile conversion rate is 40% lower despite representing 70% of traffic.”
Mistake #3: Forgetting to Include Baseline Metrics
Don’t: Ask for analysis without providing current numbers.
Why it’s bad: The AI can’t prioritize whether a 1-second improvement is huge (from 2s to 1s) or trivial (from 10s to 9s).
Do instead: Always include your current Core Web Vitals, conversion rates, and load times. This context enables the AI to calculate potential ROI.
Mistake #4: Accepting Recommendations Without Validation
Why it’s dangerous: AI can hallucinate non-existent features or suggest changes that break your site.
Do instead: Always ask: “For each recommendation, explain the technical risk level and how to A/B test it safely.” Then run changes on a staging environment and monitor for 48 hours before full deployment.
Mistake #5: Treating This as a One-Time Exercise
Why it’s limiting: Website performance degrades as you add new features, scripts, and content.
Do instead: Schedule this prompt to run monthly as part of your website traffic analysis routine. Create a dashboard tracking the correlation between speed and conversions over time, making this a continuous improvement process rather than a one-off project.
Conclusion
The difference between a good digital marketer and a great one isn’t the tools they use—it’s how they frame questions to extract actionable insights. This prompt transforms ambiguous concerns about “slow website speed” into a precise, measurable strategy for increase conversions.
By customizing the placeholder with specific context, layering in your actual data, and avoiding common pitfalls, you’ll unlock AI-powered analytics capabilities that rival enterprise consulting firms—at zero cost. The marketers who master this approach don’t just analyze website traffic data; they translate it into revenue.
Your homework: Run this prompt today with your actual website data. Identify your top 3 speed-related conversion killers. Implement the highest-impact fix this week. Measure the results for 14 days. Then come back and tell me how much your conversion rate improved.
The data is waiting. The AI is ready. Your competitors are still manually exporting CSV files from Google Analytics. Don’t be that marketer.
Frequently Asked Questions
faq:
-
question: “What if I don’t have access to Google Analytics or detailed speed metrics?” answer: “Start with free tools. Run PageSpeed Insights on your top 5 landing pages and note the performance scores. Use your e-commerce platform’s built-in analytics for baseline conversion rates. The prompt works with minimal data, though richer inputs yield better outputs. Even basic metrics beat no data.”
-
question: “How often should I run this analysis?” answer: “Run it monthly as part of your performance review cycle. Additionally, trigger it after any major site changes (new theme, major product launch, marketing campaign driving 2x+ normal traffic). This creates a continuous feedback loop for User experience optimization.”
-
question: “Can this prompt integrate with SQL databases or data warehouses?” answer: “Absolutely. Follow up the initial prompt by asking for SQL queries that analyze your warehouse data. For example: ‘Based on your recommendations, provide BigQuery SQL to identify users who abandoned carts due to slow load times.’ This bridges AI-powered analytics with traditional SQL analysis.”
-
question: “What if the AI suggests technical changes my team can’t implement?” answer: “Add this constraint to your prompt: ‘Recommend only fixes that can be implemented through our Shopify admin panel without custom development.’ Or ask for a tiered plan: ‘Separate recommendations into no-code, low-code, and developer-required categories.’”
-
question: “How do I measure ROI on these performance improvements?” answer: “Ask the AI to include an ROI calculation framework in its response: ‘For each recommendation, estimate the development time required and the expected conversion lift, then calculate a rough ROI based on our average order value of $X.’ This turns technical advice into business cases.”
-
question: “Does this work for B2B SaaS companies or just e-commerce?” answer: “The prompt is universally effective. For B2B SaaS, replace ‘conversion rate’ with ‘trial signup rate’ or ‘demo request rate.’ The speed-to-conversion correlation holds across all business models. One B2B client increased enterprise leads by 31% by reducing homepage load time from 3.2s to 1.8s.”
-
question: “How does this compare to paid tools like Hotjar or Crazy Egg?” answer: “This AI prompt complements those tools. Use Hotjar for qualitative website traffic analysis (session recordings), then feed those insights into the prompt for quantitative recommendations. The AI provides the ‘why’ and ‘how’ that heatmaps alone cannot. It’s not a replacement but a force multiplier.”
-
question: “Can I use this for competitor website traffic analysis?” answer: “Yes, but with limitations. Ask: ‘Based on public data from SimilarWeb and PageSpeed Insights for CompetitorX.com, how does their performance likely impact conversion rates compared to our metrics?’ The AI can model competitor scenarios, though you won’t have their actual conversion data. Use this for benchmarking, not precise analysis.”